
Monte Carlo Analysis

What is Monte Carlo analysis?
Monte Carlo analysis is a mathematical simulation method that involves running a very large number of trials with many different random variables. These simulations improve our understanding of the range and distribution of potential outcomes when so many uncertain and interactive factors are at play. For our purposes, this means feeding our program a variety of assumptions (current age, retirement age, investment choices, expected return, market volatility, savings habits, spending goals, etc.) and using it to generate thousands of results to illustrate the impact that uncertainty has on long-term financial planning.
If you’d really like to dive into the technical weeds, have at it.
Why is Monte Carlo analysis important?
Factors that impact the growth of your nest egg fall into two categories: those you can control and those you can’t. The first category includes things like the amount you save, the amount you spend, and your investment selection. The second category includes unexpected life events, general economic conditions, and the performance of your investments. It’s this second group that deals with the essence of risk—the unknown.
Most of the tools available to folks today do a poor job of demonstrating the outsized role that randomness plays in financial planning. This is why we created Honest Math. We believe everyone should have access to affordable and easy-to-use tools capable of plainly illustrating how things within your control (e.g. your habits) and things outside of your control (e.g. financial markets) affect long-term investing. Honest Math allows anyone—from new investors to experienced pros—to develop a sophisticated financial simulation dashboard within a matter of minutes. This gives you the power to create scenarios and run an unlimited number of simulations to illustrate how your nest egg might hold up under different conditions.
How about an example?
Each scenario shown here assumes a 40-year investment horizon and $5,000 in annual contributions. The blue chart randomizes the annual investment performance for each trial to produce a simple average of 8%. The variation in ending account balances—ranging from $780K to $2.1 million—illustrates the significant impact that market volatility and the timing of investment performance have on the growth of your nest egg, even if the “average” return is the same across all scenarios.
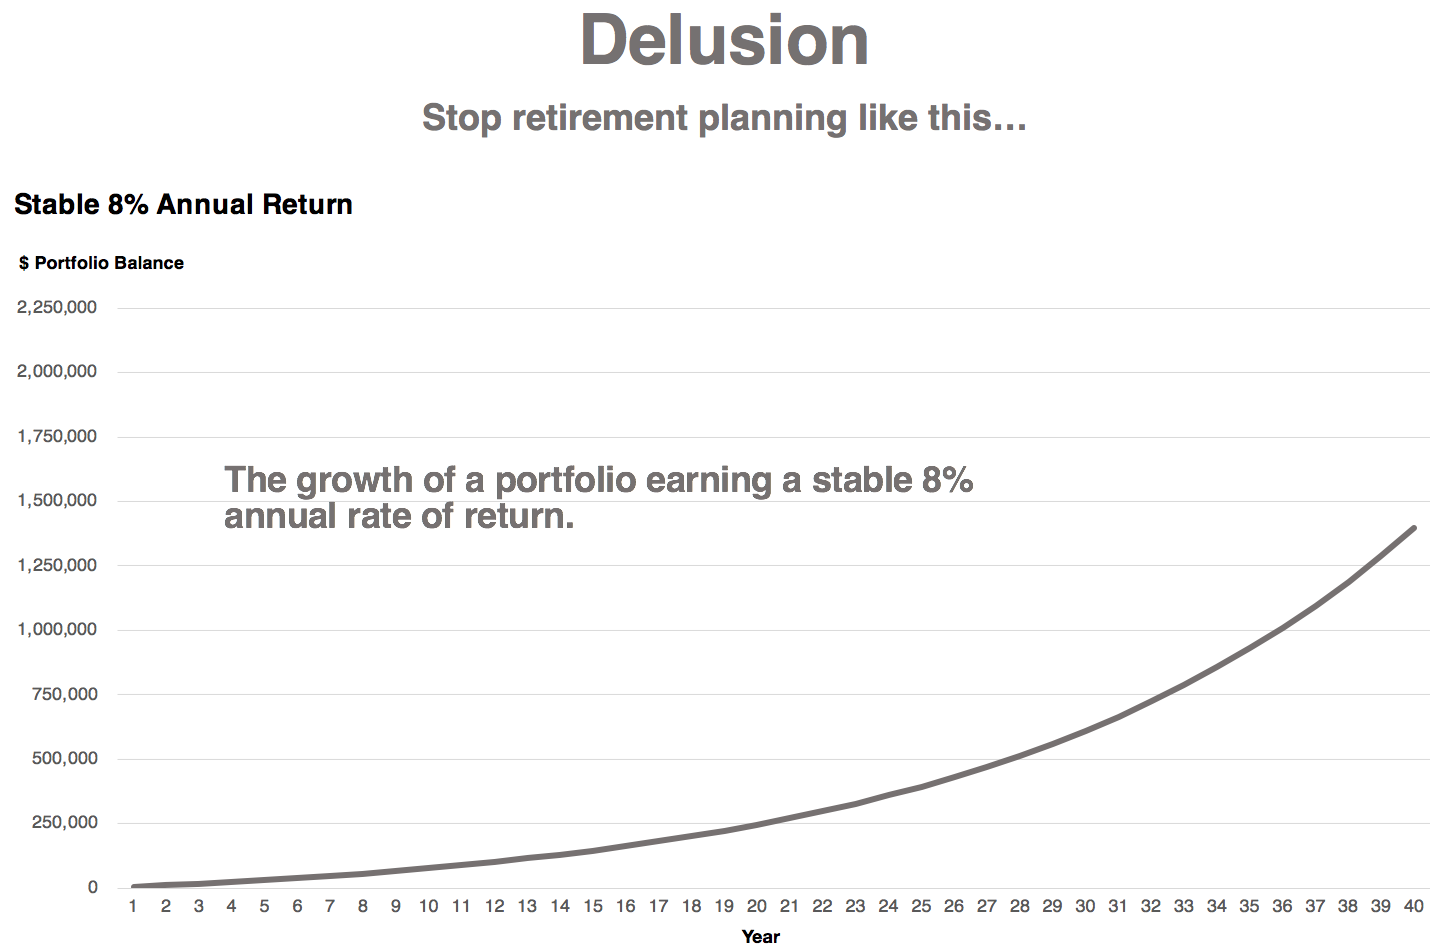
Achieving consistency like this is impossible. Just ask this guy’s former clients.

Such is life.
This example plainly illustrates the fatal flaw in assuming a simple average rate of return when forecasting portfolio performance. Planning this way is common because it’s easy and intuitive. But it can also be wildly misleading. This could mean bad news for your retirement goals, even if your “average” return is equal to (or greater than) what you or your advisor planned for.
If you’ve never thought about investment performance from this perspective before, that’s okay. You’re in (famous) company—even some of the most popular names in personal finance don’t seem to have a firm grasp on these concepts.